
|
|
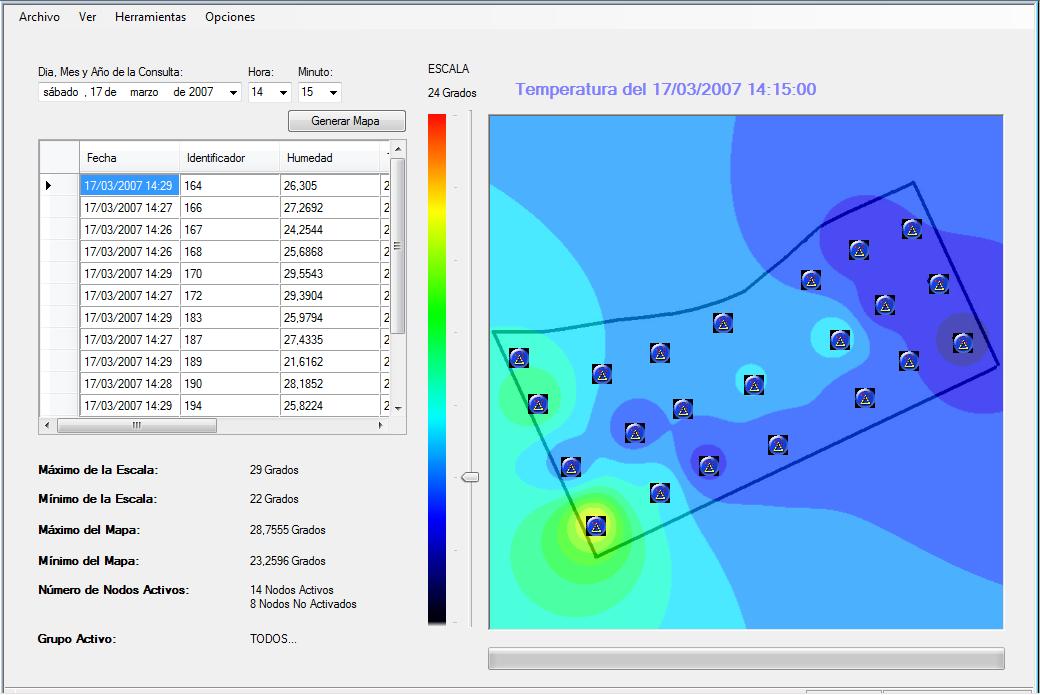
WiseObserverA tool for the visualization of agronomical parametersWiseObserver is a Wireless Sensor Network Data Visualization Framework for the visualization and analysis of data collected by a wireless sensor network in a generic scope of application. WiseObserver allows the generation of various types of charts for easy visualization of the data collected by the sensors. WiseObserver also includes a module to add external data not collected by nodes, but related to the environment under study. All these functionalities have been implemented taking into account the end-user requirements: fast and friendly access to the data collected by the sensors.
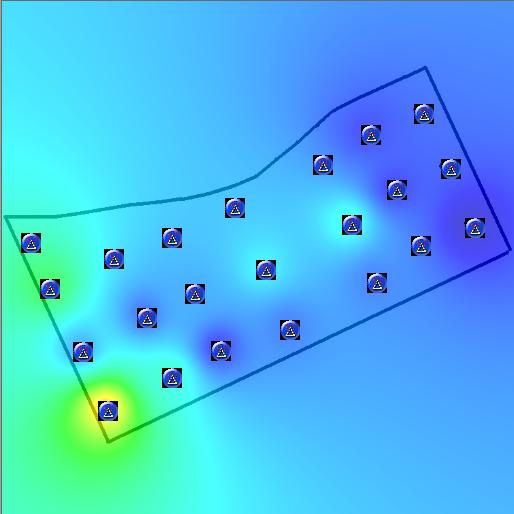
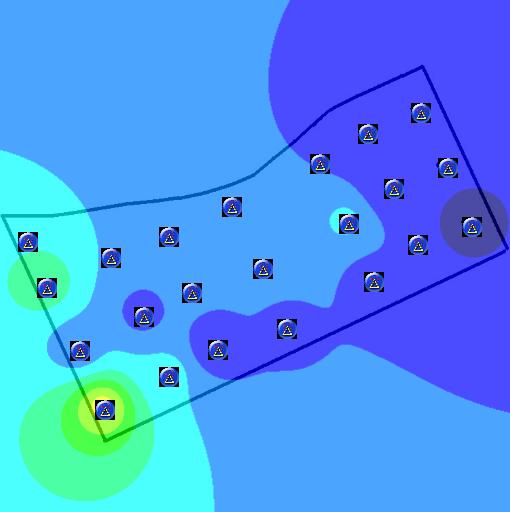
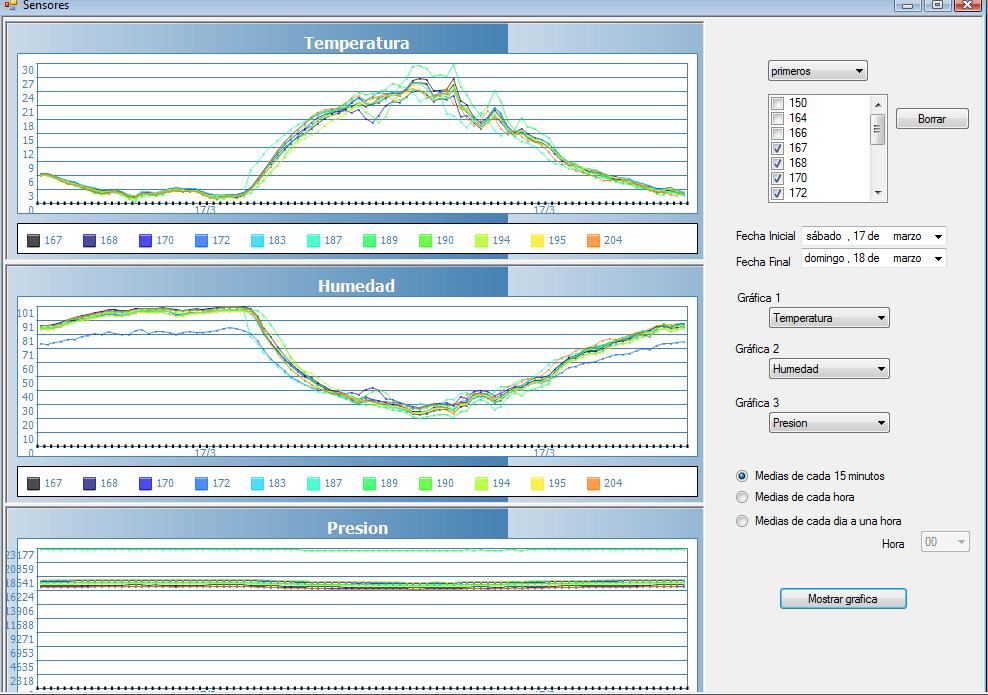
WiseObserver includes several modules to present the information obtained in various formats. The figures below illustrate the main features of WiseObserver. The figures under various formats the data collected and processed within the frameworks of the WiseVine project where a network consisting of sixty-six nodes distributed across twenty-two observation points was deployed in vineyard exhibiting non-uniform soil conditions. The aerial picture below clearly shows the variability of the vineyard where the network was deployed. 
 WiseObserver also includes all the required network management functionalities thanks to the execution of commands in network nodes, including the monitoring of the network nodes and management of the security restrictions to the data. WiseObserver has been designed bearing for easy maintenance and portability to different hardware platforms. A more in-depth description of the WiseObserver tool can be found in [1].
REFERENCE [1] J. Castillo, A. Ortiz, V. López, T. Olivares and L. Orozco-Barbosa. |

|
|
Instituto de Investigación en informática de Albacete, Campus Universitario s/n 02071 |